Dies ist eine alte Version des Dokuments!
Inhaltsverzeichnis
Decoding the wireless heating control Vaillant CalorMatic 340f (868MHz)
In our appartment, we have a wireless heating control system made by Vaillant (probably 8-10 years old). Since I recently started into Smart Home and Home Automation (well, so far, i have mainly set up a huge net of all different kinds of sensors and some light bulbs, as I have hardly anything that could be controlled wirelessly), of course I wanted to figure out how the wireless device works and in particular whether I could include it into my OpenHAB-based home network of things…
To detect and analyze the wireless signals, I'm using an RTL282x-based DVB-T dongle together with the RTL-SDR software.
Figuring out the Frequency
From the outside it does not give any indication about which frequency it uses.
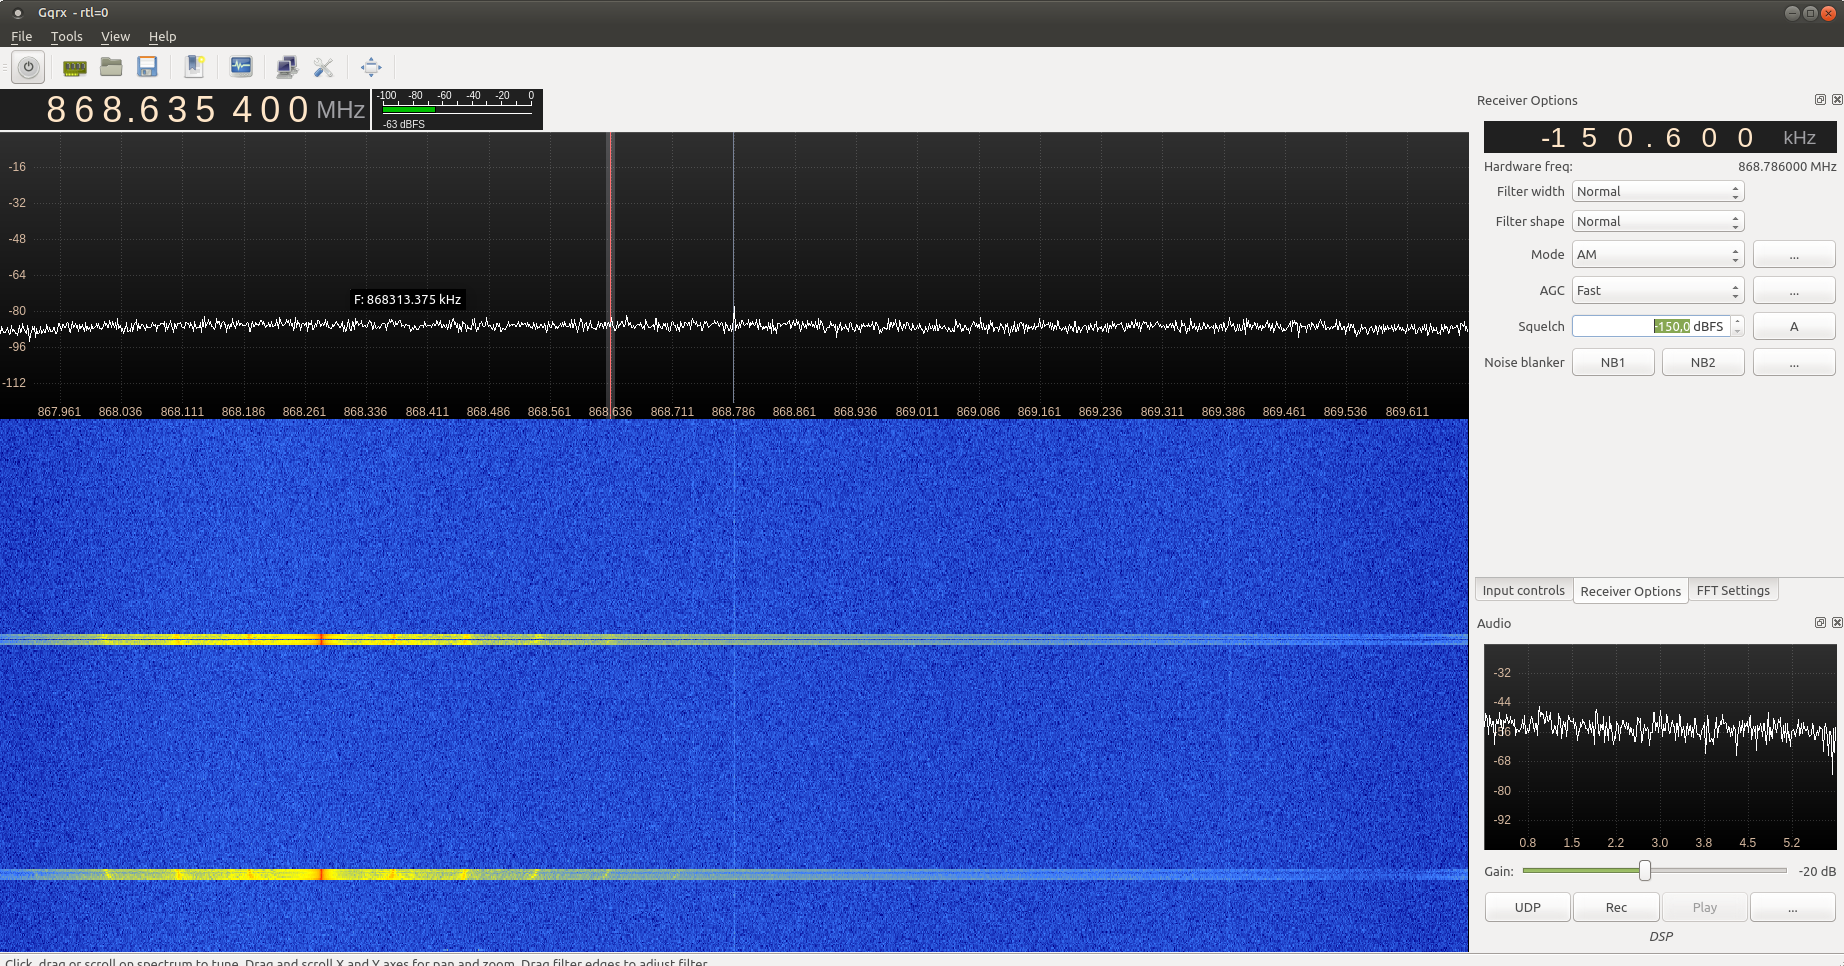
I figured it could only be one of the ISM bands, which in Europe are 433MHz, 868MHz and 2.4GHz and 5GHz. Since the latter two are mainly used for WLAN, Bluetooth, etc. that left me with two possible frequency ranges. Firing up gqrx, tuning to either 433MHz and 868MHz and changing the target temperature of the thermostat, gave me perfect bursts in the 868MHz band with peaks around 868.275 MHz:
The device
Curious as I am, I decided to disassemble the thermostat and check which chips and which transceiver are used:

![]()
While the back does not give any indication, dismantling the thermostat even further reveals the transceiver and its chip: an Infineon TDA5250D2 for the 868 MHz band.
Detecting the Signal
As we now know the frequency, let's take a look at the signal. There are multiple ways to transport digital data at a certain frequency. Most 433.92MHz devices use ASK (Amplitude Shift Keyring, the binary equivalent of amplitude modulation, i.e. AM) in its simplest form of OOK (On-Off-Keyring), which simply means that the frequency has either full amplitude (to indicate 1) or is absent (indicating 0). The 868MHz band and even more the 2.4GHz band use all different kinds of modulations, like FSK (frequency-shift keyring, i.e. the digital equivalent of FM) or even Phase-shift keyring, etc.
The transceiver data sheet states it is an ASK/FSK receiver for the 868MHz band, so let's first try to demodulate the signal as ASK. A hint that the signal really uses ASK can be seen from the waterfall chart in gqrx, as the peak stays at a fixed frequency, while a signal in FSK typically shows two peaks (as the modulation works by switching between two frequencies to indicate 0 and 1 respectively).
So, let's try demodulating the signal as ASK and in particular check for OOK.
In gqrx, I tune to the 868MHz band (near, but not exactly at the 868.275MHz we determined above) and record the signal to a wave file. To do this, make sure you set the mode to „AM“ (i.e. use ASK demodulation) and press the „Rec“ button at the bottom. This will create a file called gqrx_[ISO-Data]_[time]_[frequency].wav in your home directory, which holds the signal demodulated as a wave file. Even though the signal is not an actual sound, one can still use the audacity application to look at the waveform of the signal. Playing it as sound would not result in anything meaningfull except for a few clicks.
Recording a transmission by the thermostat and opening it in audacity gives this picture:
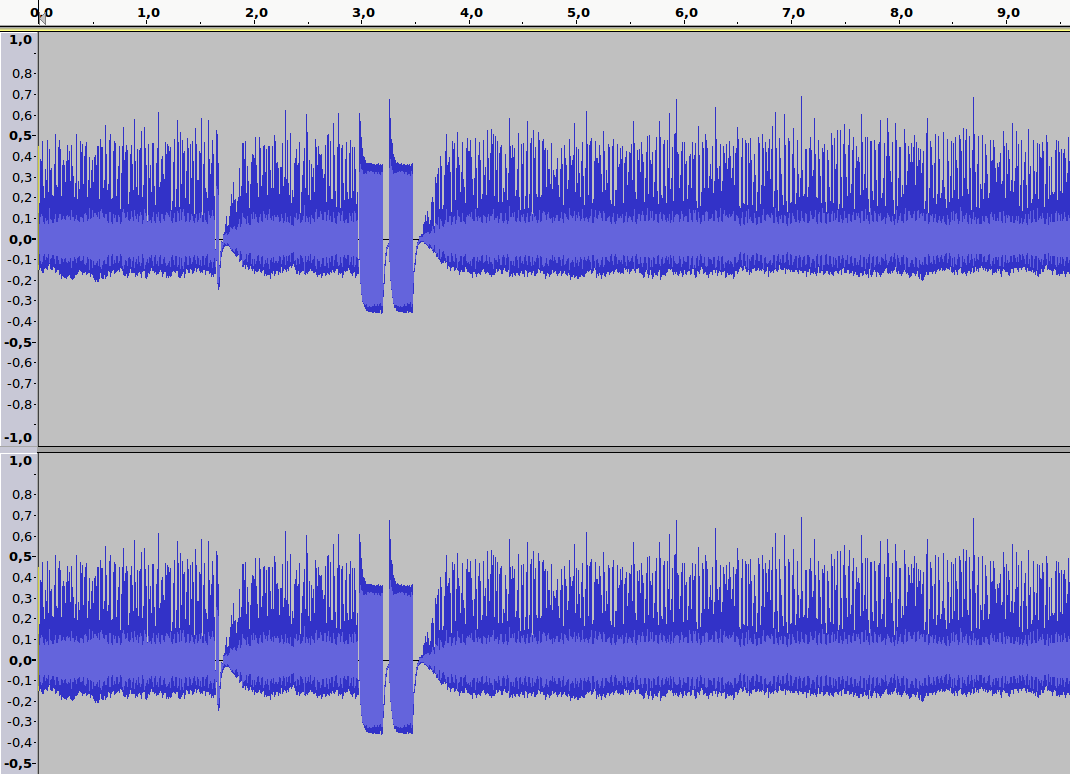
Not bad. We clearly see that there are two spots where the wave form obviously changes its form. Let's zoom in a little bit in audacity:

This signal seems to be repeated twice.
Yay, it seems our first guess to use ASK / OOK was right. We clearly see a signal with some long and short bursts, all with roughly the same amplitude and consistent on/off durations.
An alternative way to obtain a AM-demodulated signal for inspection in audacity is the command-line utility rtl_fm from the RTL-SDR project:
   reinhold@zweistein:~$ rtl_fm -f 868275000 -M am -s 44100 `date -I`_test.sdr
   Found 1 device(s):
     0:  Realtek, RTL2838UHIDIR, SN: 00000001

   Using device 0: Generic RTL2832U OEM
   Found Rafael Micro R820T tuner
   Tuner gain set to automatic.
   Tuned to 868528575 Hz.
   Oversampling input by: 23x.
   Oversampling output by: 1x.
   Buffer size: 8.08ms
   Exact sample rate is: 1014300.020041 Hz
   Sampling at 1014300 S/s.
   Output at 44100 Hz.
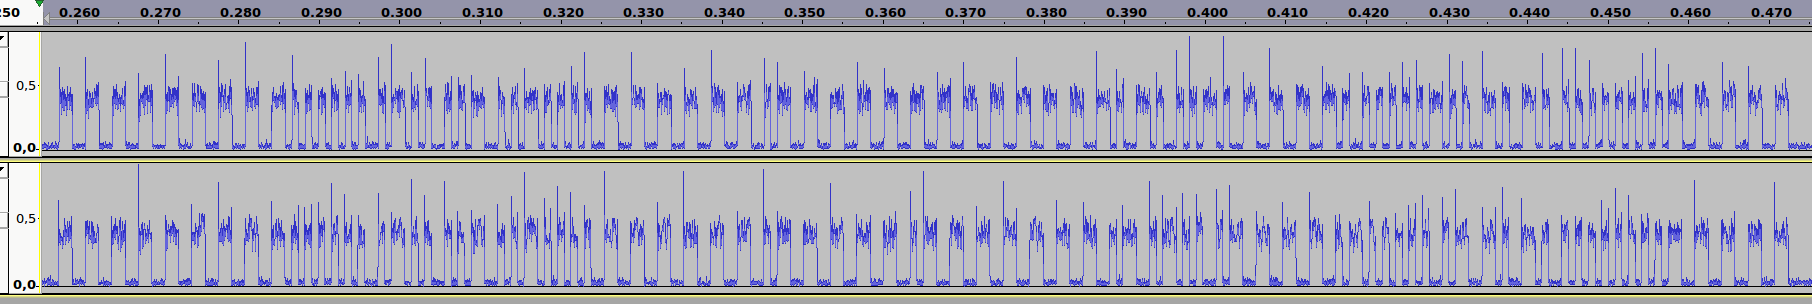
The resulting file (in the above example 2017-04-21_test.sdr) is not a wav file, but contains raw data that can be imported into audacity with the menu item File → Import → Raw data. The import settings are „Signed 16-bit PCM“, „Little Endian“, „1 channel (Mono)“ and the sampling rate is 44100. I had to zoom in vertically, as the signal appeared very faind. Personally, I find the resulting wave form easier to handle, as it shows the absolute values and shows the on/off signals even clearer:

What is clearly visible already in these images is that there are only two different lengths of the UP and the DOWN pulses: long and short. But what do they actually mean?
Figuring out the encoding of the signal
Now that we have a signal, let's try to understand the data that is sent over the ether. Unfortunately, the signal did not resemble anything that I had seen with my 433MHz devices. With them, either it was all short UP bursts of idential length and the 0/1 information as encoded in the DOWN time distance between the bursts (i.e. it was very short UP, and then either short or long DOWN), or the UP and DOWN signals together always had the same length (Pusle-width modulation, i.e. it was either short UP + long DOWN or long UP + short DOWN).
In our case, we have all different combinations of UP and DOWN: long UP + long DOWN, long UP + short DOWN, short UP + long DOWN, short UP + short DOWN. So maybe the up and down both encode one bit, i.e.
| UP | DOWN | binary value |
| short | short | 0 0 |
| short | long | 0 1 |
| long | short | 1 0 |
| long | long | 1 1 |
Let's put our hypthesis to the test: Simply transcribe our signal from above (and it's repeat sequence) using this decoding:
111111111111111110000000000001001000010000110000100000000111111111111100111111111111111111111111100110010000100111111110010000000000100001100110010000000000000000111111111
111111111111111110000000000001001000010000110000100000000111111111111100111111111100111111111111110011001000010011111111001000000000010011100110010000000000000000111111111
Hmm, we clearly see some longer sequences of 0 and 1 repeated (at the beginning and end it might make sense as kind of preamble and epilogue). However, the irritating fact is that the repeat is apparently not an exact repeat, especially towards the end all bits appear shifted. And in some other cases it does not even have the same signal length, but two bits more! Something can't be right….
Until I compared the signal and its „repeat“ in Audacity (signal is on top, repeat on the bottom):
Surprisingly, both signals always have exactly the same length in milliseconds and can be perfectly aligned, they just sometimes have a different number of UP/DOWNs!
Do you see where the difference starts and where it ends? Also, do you see why the bits in our simple transcription above are shifted?
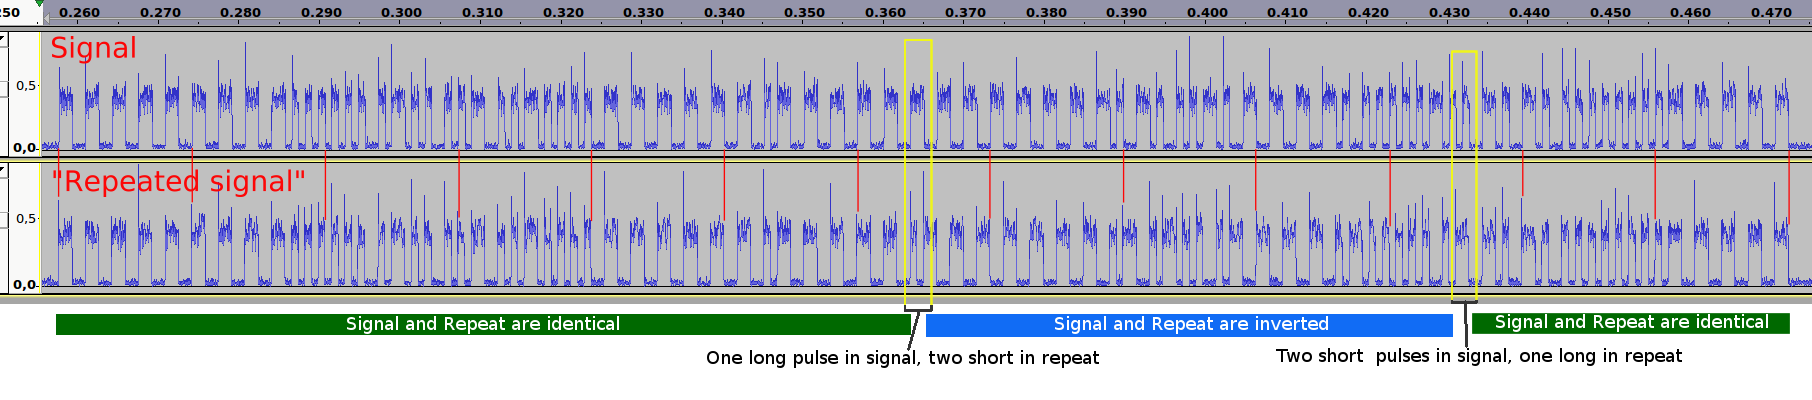
So clearly one long and two short pulses correspond… Something else to notice: There is a transition from UP to DOWN or from DOWN to UP every time interval that corresponds to one long pulse. Check my annotated signal: Every ten long pulses I placed a red bar. I.e. at regular intervals there is a guaranteed transition from UP to DOWN or vice versa. For short pulses there is an additional transition in between, but the regular transitions appear through the whole signal…
If we look at the signal in the application inspectrum (you need to use the output of a rtl_sdr recording!) and lay a grid with the proper width over the whole signal, we can confirm that no long UP or long DOWN pulses cross a grid line:
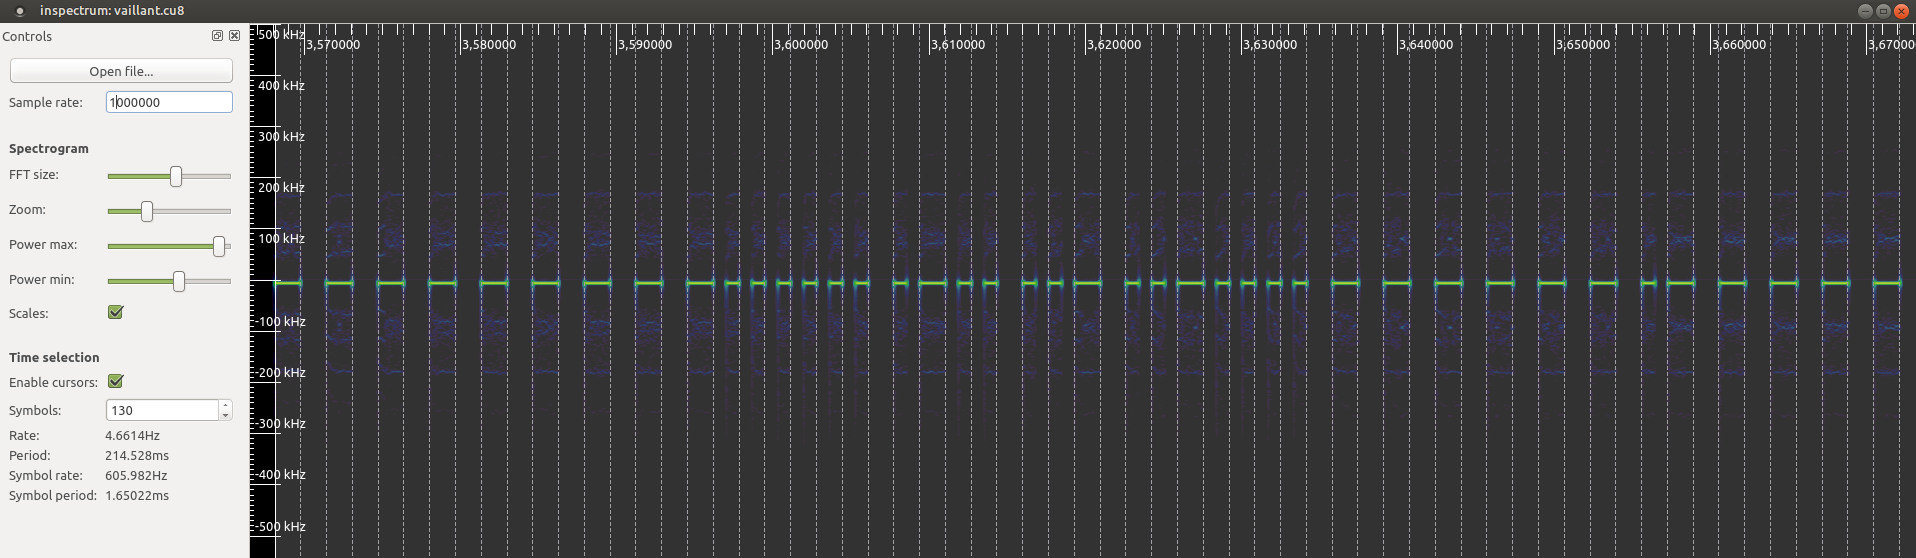
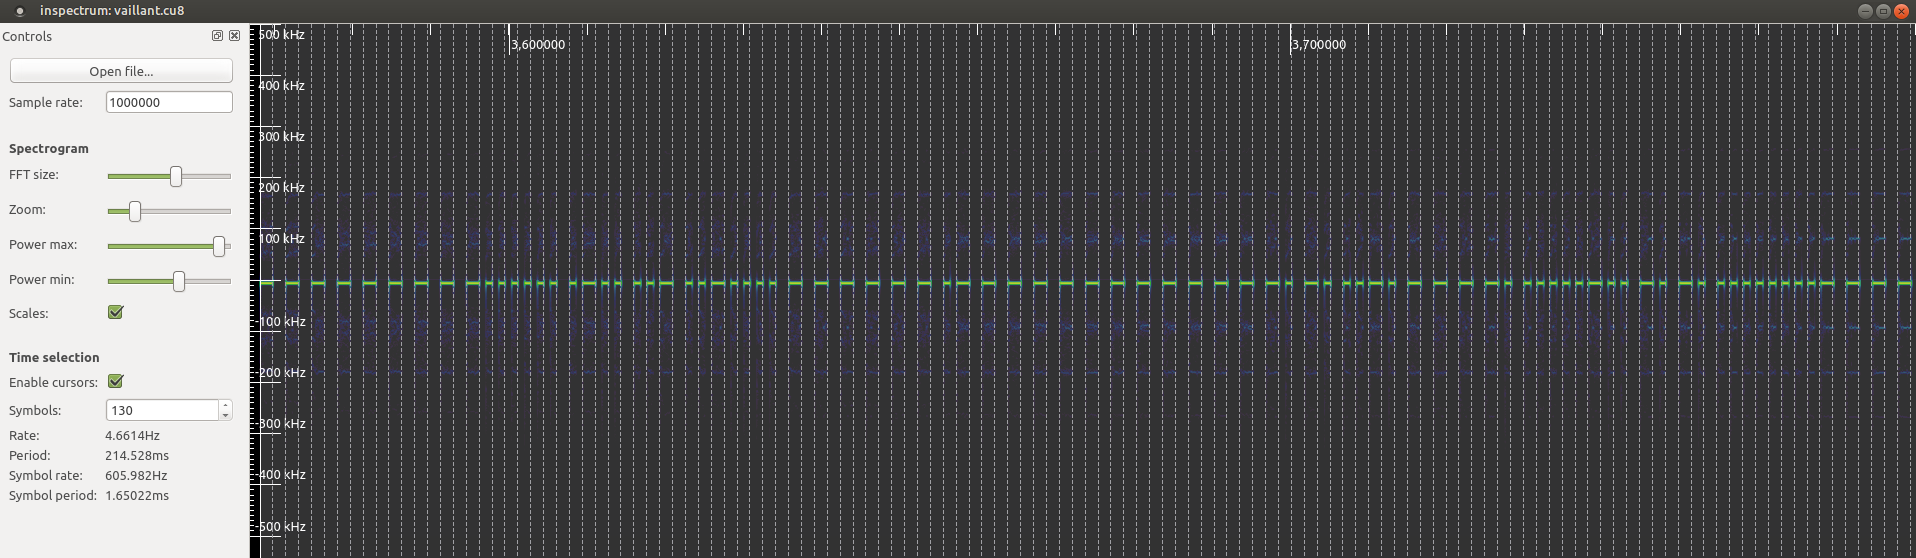
For now, we have determined that the basic time interval of the signal is that of one short pulse and the long pulses are exactly twice as long. Inspectrum also tells us that one signal (without repeat) is 215ms long with 130 symbols and the symbol rate (data frequency) is 606 Hz, i.e. there are 606 long intervals per second.
So, every 1.65ms there is a transition (i.e. we have a binary base signal of 606 Hz), and sometimes there is an additional transition halfway in between.
So let's transcribe each long UP signal as 11, each long DOWN signal as 00 and each time period with a transition from DOWN to UP as 01 and from UP to DOWN as 10. I.e. we transcribe our binary signal as OOK with a base frequency of 1212 Hz. The signal and the repeat in our example above would then be:
11001100110011001100110011001100110101010101010010110101001010110010101101010101001100110011001100110011001011001100110011001100110011001100110011001100110011010011010010101101001100110011001101001010101010110101001101001101001010101010101010110011001100110011
00000000000000000000000000000000000
11001100110011001100110011001100110101010101010010110101001010110010101101010101001100110011001100110011001011001100110011001100101100110011001100110011001100101100101101010010110011001100110010110101010101001011001101001101001010101010101010110011001100110011
Getting a file of 0/1 states
Recording to a .wav file and then looking at it in audacity to see the binary signal helps a lot when trying to understand the structure of a signal, but it is not feasible for testing multiple combinations. It would simply take way to long to transcribe signals to 0/1. So let's use a program to do this: gnuradio, in particular the gnuradio companion (GRC).
GNUradio is a signal processing framework built on top of Python, with the GNUradio Companion (GRC) being a really nice graphical frontend to build signal processing pipelines. I use the following flow to read raw data from my RTL2838 DVB-T stick, convert it to a 0/1 time series (where each short time interval is converted to either 0 or 1):
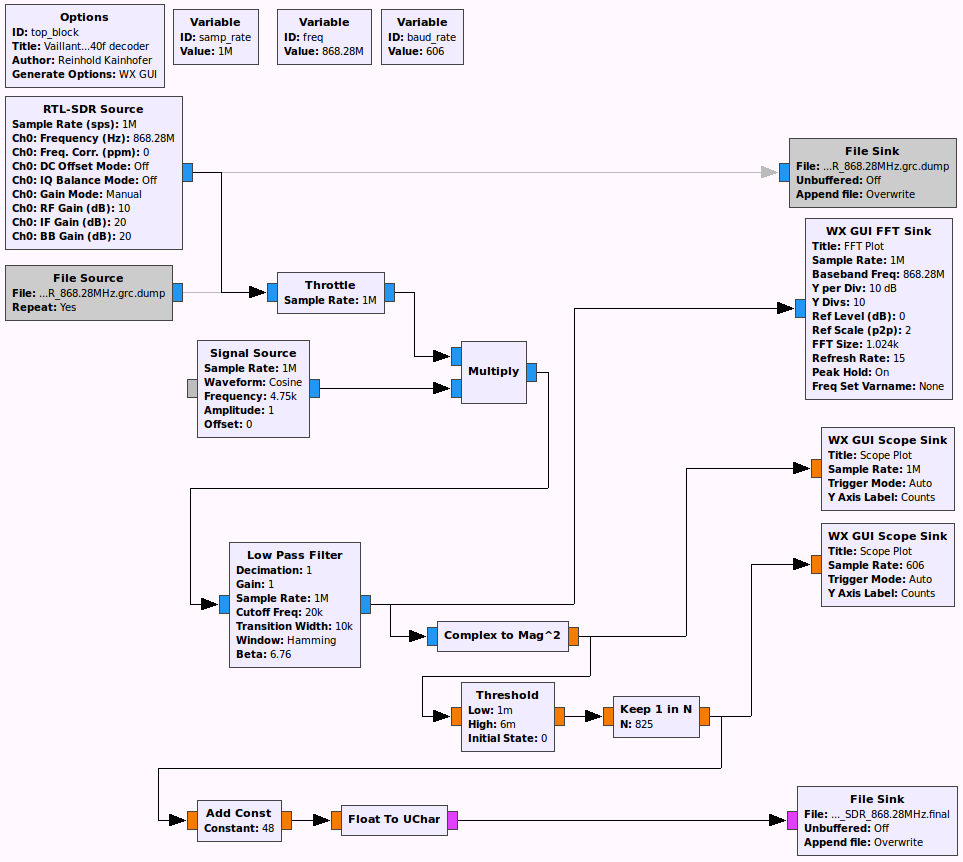
The corresponding .grc file can be downloaded here. What this GRC file does:
- RTL-SDR Source: Read data from the RTL-SDR source (the DVB-T stick) with a sample rate of 1 million samples/sec, tuned to 868.28MHz
- Multiply: Shift the peak of the signal to the center so we have best signal (the shift depends on the individual stick, so you might need to modify this) (the Multiply)
- Low Pass Filter: Cut off everything outside a frequency range around the desired frequency
- Complex to Mag^2: the ASK / OOK demodulation (i.e. extract the amplitude of the signal, holding the 0/1 information)
- Threshold: convert the amplitude to pure 0/1 values (depending on your signal strength and the noise, you might need to adjust the parameters)
- Keep 1 in N: As we read 1m samples per second from the DVB-T stick, each short burst in our signal contains 825 data points (the 606 Hz symbol rate, where each „symbol“ contains two half-intervals, i.e. each second contains 606*2 short intervals ⇒ 1.000.000/(606*2)=825)
- Add Const + Float To UChar: Convert the numbers 0 and 1 to the ASCII characters '0' and '1'
The result is a file containing the characters 0 and 1 for our signal, where each digit represents the on/off state of each short pulse of length 0.825 ms.
Now we have the raw file containing the signal, let's
What do the long and short pulses actually mean in binary?
Having a transition from UP to DOWN or from DOWN to UP at regular intervals sounds a log like Manchester Code.